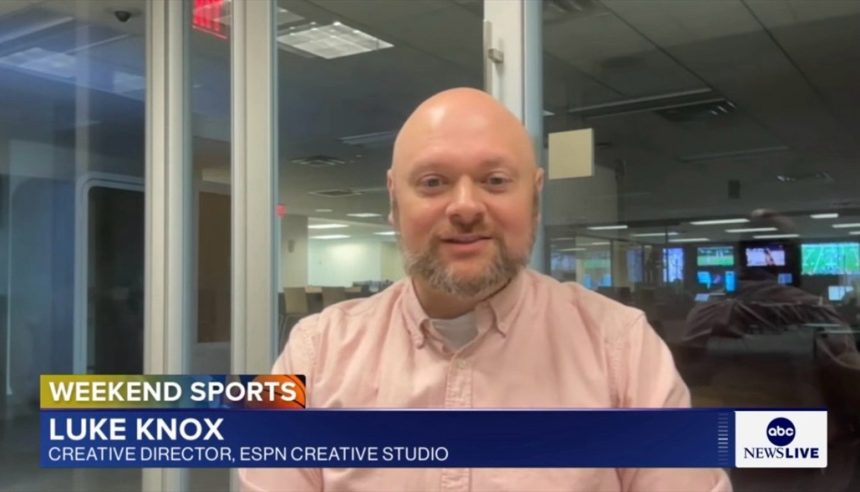
Luke Knox, Creative Director at ESPN, speaks with TK Sajeev , Editorial Director of NewspaperDesign.org, about how his team redefines digital sports storytelling through sharp design, smart data, and mobile-first creativity.
How would you describe your role as Creative Director at ESPN?
I work on a diverse team of storytellers (designers, photo editors, web developers and story editors), and my day-to-day is a mix of project work and leadership of our photo department as well as story greenlighting process.
What’s your creative philosophy when designing for a sports-focused digital platform?
Get right to the point! Sports fans in this day and age have limited time to look on their phones or other devices, so it’s important to grab them in the first few sections with something meaningful.
How do you balance ESPN’s established visual identity with innovation and experimentation?
We treat our work like a lot of publication design, where the ESPN brand and standard look/feel need to come through in the final product. We also do quite a lot of text-based longform storytelling. So the innovation and experimentation often are focused on A) the visual assets we build with, such as 3D elements, rich data visualizations or custom artwork, and B) the user experience, such as unique ways to navigate a story or add animation.
What does “good design” mean in the context of sports journalism?
Good design in this field balances utility and excitement. What we create needs to tell a clear, concise story and deliver the news element of the story first and foremost — that’s what fans are passionate about. At the same time, you’re covering a topic that’s full of emotion, intensity and drama, so a good visual storyteller knows has to punctuate the story with that energy.
Can you walk us through ESPN’s creative workflow — from concept to final publication?
Our process on a custom web presentation looks like this:
- Story concept pitch: We look at ideas from outside editorial groups, as well as ideas within the Visual Storytelling team.
- Pitch is greenlight, team is assigned: Once a story pitch is approved, we fill out the project team (design, development, photo editing, general storytelling, project management)
- Kickoff meetings (1-2 weeks): We have two meetings, both a content-based one and a creative one, that align the team on the idea and goals.
- Wireframe design phase (1-3 weeks): Basic design phase, without real imagery or color, to block things out.
- Final design phase (2-3 weeks): Finishing touches of the design, adding real content to the mocks.
- Web development phase (1-3 weeks): Build of the web product to match the mocks precisely. A “preview link” is shared as things start to come into shape.
- QA testing (1 week): Link is tested rigorously for any issues across common browsers and devices, and adjustments are made on any issues that are found by the team as they test.
- Launch/post-launch: Project goes live on ESPN.com, typically published first thing in the morning. Engagement metrics are gathered a few days later, and we schedule postmortem discussions to discuss/document how everything went.
How closely do designers collaborate with writers, editors, and data journalists?
Design leads and designers are in close contact with editors and data journalists in our projects. We also have an editor-like role on our team called Storytelling Lead, who serves as a bridge to the editorial partners you mentioned. For designers, it’s important that they keep the story as the driving force of their creative decisions … so they’re encouraged to be curious, ask questions and do what they can to serve the story best.
What tools or software does your design team rely on most for storytelling and infographics?
We create design mocks using Figma, and leverage the Adobe Creative Suite programs to create more custom visuals within the design. The development team uses a variety of approaches, including React as a framework. The team has recently started training on Adobe Premiere Pro to take on some video editing duties when they intersect with our work. For data visualizations, we have Adobe Illustrator templates but also look at chart libraries such as Datawrapper. Generally, we try to stay nimble to industry changes, so this list evolves over time.
How do you decide when to use static visuals versus interactive graphics or motion design?
My take on this: static should be the default approach on most storytelling elements when there’s information to convey, and motion/interactivity can be added only when they truly add clarity or value to the experience. On moments like an introduction that are less about conveying information and more about a broad concept, motion design can be quite effective to surprise and delight the audience.
ESPN is known for strong visual data storytelling — how do you approach creating infographics that appeal to both casual fans and data enthusiasts?
All good data visualizations are tailored to the intended audience. So for us, the intended audience is sometimes more general (a fun statistic in a story meant to reach casual fans), and sometimes more diehard (a series of advanced analytics data on a complex subject). For the former, we present data as a single number, a single pie chart, simple bar chart, etc, and try to add more labeling and clarity. If we’re targeting the enthusiasts, we will use more rich visualizations, larger datasets, etc.
How do you ensure data accuracy and clarity in graphics that are built under tight deadlines (like during live games)?
We try to run things through some layers of quality control, like story editors or our copy desk which is staffed nearly around the clock. We also try to lean into data flows that are more automated and from trusted sources. For example, we do a yearly project presenting the playoff probabilities of all NFL teams in real time during the last two weeks of the season, and we’ve built a data pipeline that brings the numbers directly into a code-based chart structure so there’s less chance for human error.
Can you share an example of an infographic or data project you’re particularly proud of — and why it worked well?
I would point to our NFL Draft Heart Rates project, which tracked four top prospects’ real-time heartbeats using Apple Watches during the 2022 NFL Draft.
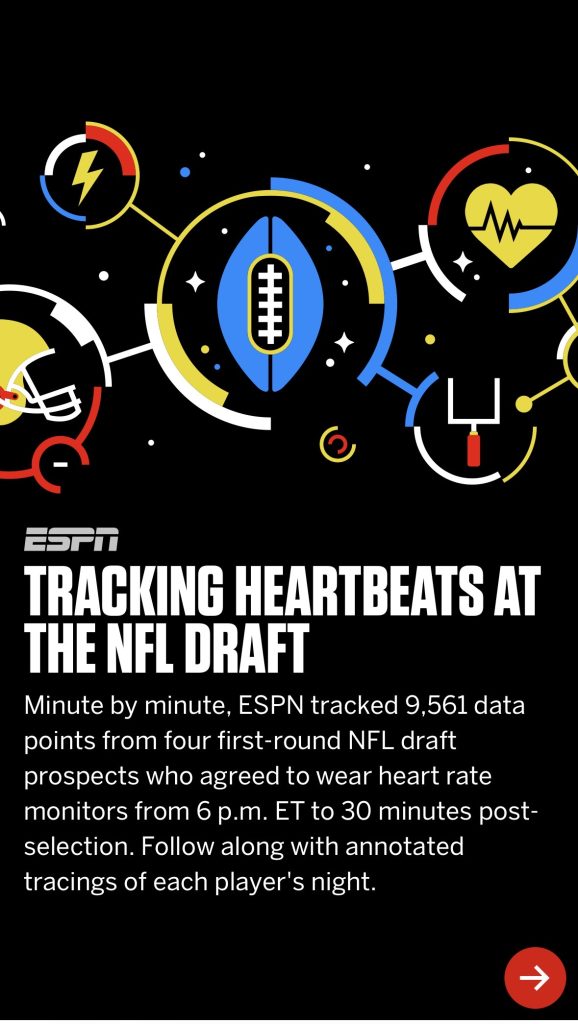
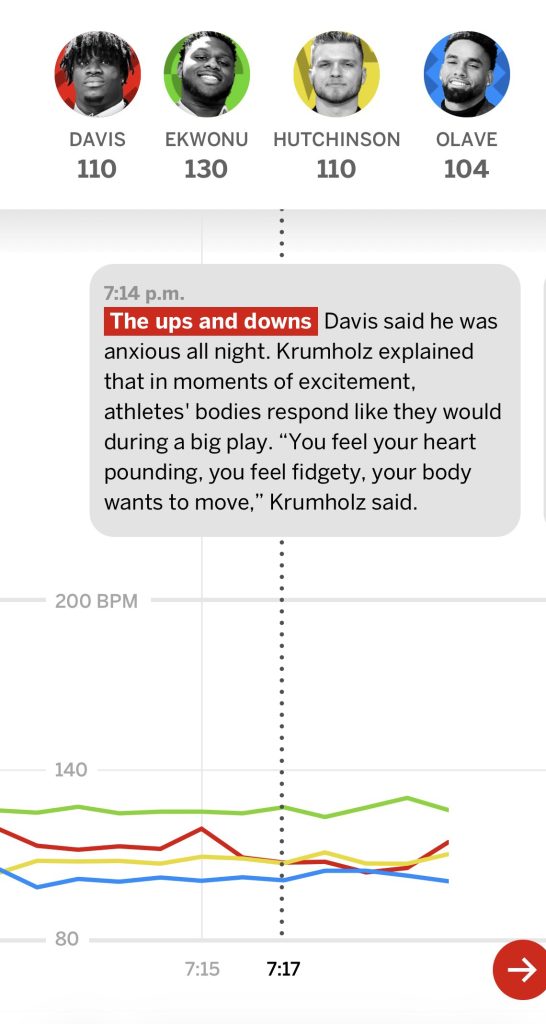
The team visualized 9,500 data points in a horizontal, minute-by-minute interactive experience that paired heart-rate spikes with key narrative moments. After a failed 2019 attempt due to data-recovery issues, improved logistics, backstage access, and player buy-in enabled success in 2022. Why it worked: The project showcased the team’s design agility, technical collaboration, and commitment to ambitious storytelling—proving that sports data can drive compelling, emotionally resonant narratives.
How do you balance visual flair with readability and accessibility?
Readability in type is very important to our team, and we have a style guide with design standards built in to ensure accessibility.
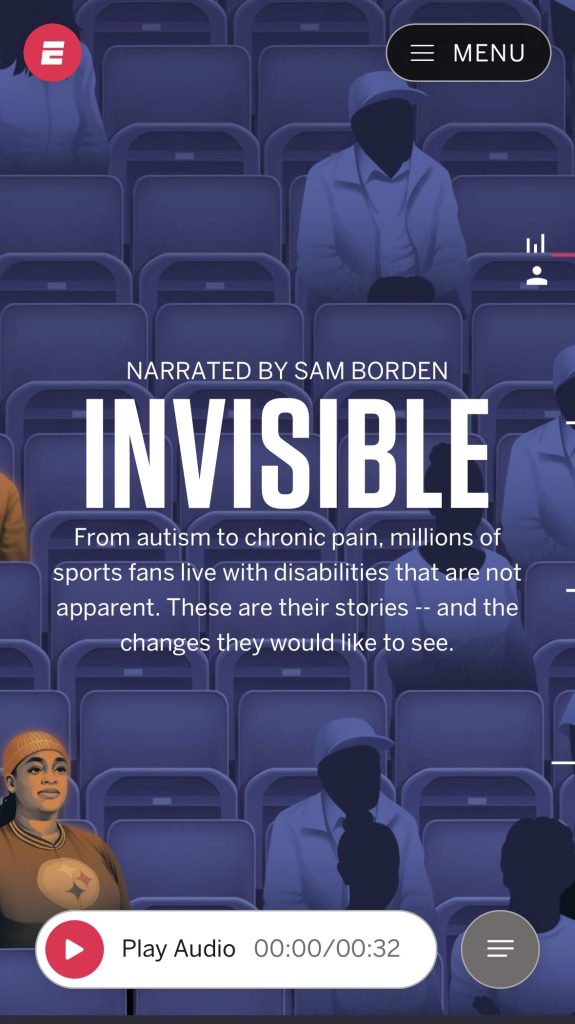
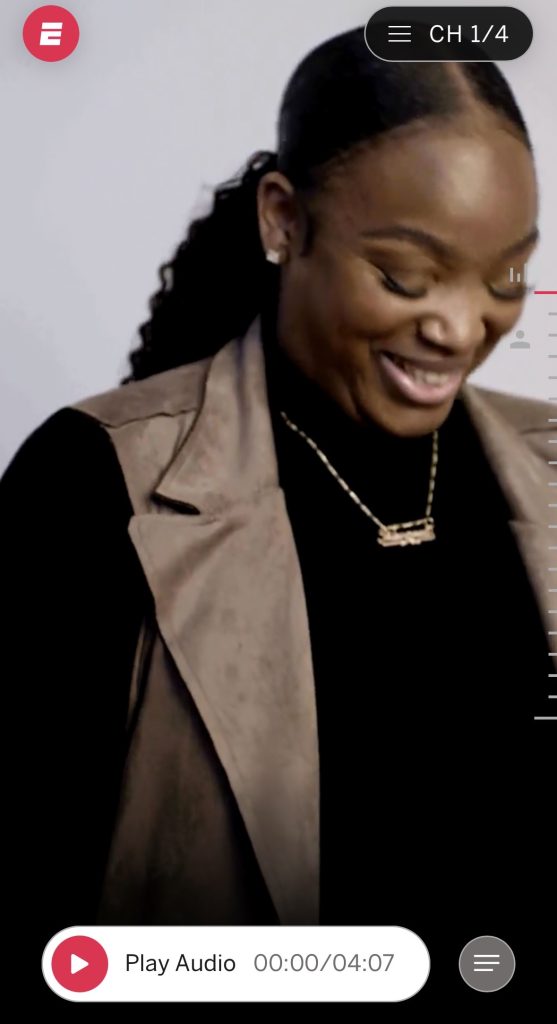
We published a project called Invisible, about fans with invisible disabilities, where we scaled back on things like motion in order to keep the piece more accessible.
How has mobile-first design changed ESPN’s creative approach?
Mobile-first design changes the game for us considerably, and it’s definitely something we focus on. Our design templates include both mobile and desktop configurations, and mobile is always shown during internal design reviews. Few things it does:
- Limits the amount of fancy interactions we add: Years ago it was popular to use a lot of pop-up info boxes for the web, but they do not create a pleasant mobile experience so we have phased them out.
- Limits how much body text we display as a block: A single mobile screen, at any point in the scroll, can hold 150-200 words of body text depending on device and font (this varies widely). When we design, there is an emphasis on keeping text blocks shorter whenever possible and breaking them up intentionally with relevant visuals (photos, charts, lists, etc).
- Limits the complexity of artwork: When working with photography or illustrations, we have to consider how everything will read on a small phone screen. If there’s a highly detailed illustration full of small Easter egg details, we often have to simplify the composition so fans on their phone are able to consume it easily and quickly.
What design considerations are unique to ESPN’s audience — compared to other media outlets?
I’d say the biggest design consideration unique to us is ESPN’s audience is the number of platforms designs can travel to. There’s web, app, social media platforms, marketing efforts, alerts sent to your phone, streaming tiles, a massive portfolio of live TV elements, and so much more. So the consideration for designers, because my Visual Storytelling org creates such a large volume of these visuals for the company: how is the design I’m making able to scale into other spaces? What specs do I need to be aware of when starting out?
How do you incorporate user feedback or engagement metrics into design decisions?
We do take engagement metrics into account, partly for design decisions and partly for strategic ones. The metrics we look at are average time spent, which is a measure of how engrossing the content is per user, and total page views, which is also useful but is very dependent on having good placement in our news feeds. Average time spent drives our design decisions the most, when we can understand the types of user experiences that resonate. For example, we’ve found that simpler long scrolling experiences yield longer average time spent than stories that require a lot of heavy clicking and interaction. For reference, 30 seconds is average time spent for a basic ESPN story, so we try to double or triple that on our projects. This Pat Tillman project had average time spent of more than 3 minutes.
How do you optimize visuals for different platforms?
Feed imagery is one good example of this. Our website requires various crops and dimensions of the main feed image for a story (16×9, 1×1, 5×2, etc), in order for the images to appear as promotion in all parts of our app and website.
How do emerging technologies (like AI, AR, or real-time analytics) shape your design strategy?
The one that comes up most in conversations lately is definitely AI. We are still getting a feel for how to leverage AI in our design thinking, and how to use it responsibly as a tool. For now, it’s very much in the “proof of concept” period, but it will be interesting to see how companies try it out in the future as a production time-saver.
What trends do you see defining the future of sports media design in the next few years?
A big trend I see: the shrinking attention spans of our general sports audience. What I mean is, people have more distractions than ever before and seem to devote less and less time to consuming longform content as they focus so much on sports social media, sports betting, fantasy sports and other things. So how the industry reacts to that trend is key — do we commit more to short-form content, personalized content, visually driven things?
How does ESPN maintain its creative edge in an industry filled with fast-moving digital competitors?
Two things we try to utilize: A) designs that emphasize the high-quality reporting and content, since our resources in that regard are industry-leading, and B) innovation, since we have skillsets in-house on things like 3D animation that not everyone else does.
How do you measure the impact or success of a visual story?
We have some benchmarks that are taken into account with visual stories, including:
- What were the engagement data points from the audience?
- What is the longer-term engagement, such as SEO equity from search engines like Google?
- What type of innovation were we able to bring into the process?
- Were there new partnerships our team was able to build or grow due to the story?
- Did we help stretch and grow individuals on the team by taking on this work?
Working with annual sporting events like championships, are you concerned about avoiding repetition?
Great question. As a big-scale company, there’s certainly similar content ideas that are produced each year around certain championships. It’s somewhat inevitable. For my team and our focus on special design projects, we try to seek out new ideas to incorporate as much as possible … maybe it’s just a small tweak of an existing element, maybe something bigger. But any form of surprise and delight that we can add to a repetitive exercise, I believe that’s part of our job as visual storytellers. For example, we’ve covered the sport of Formula 1 for years, and the news whenever the cars go through an evolution.
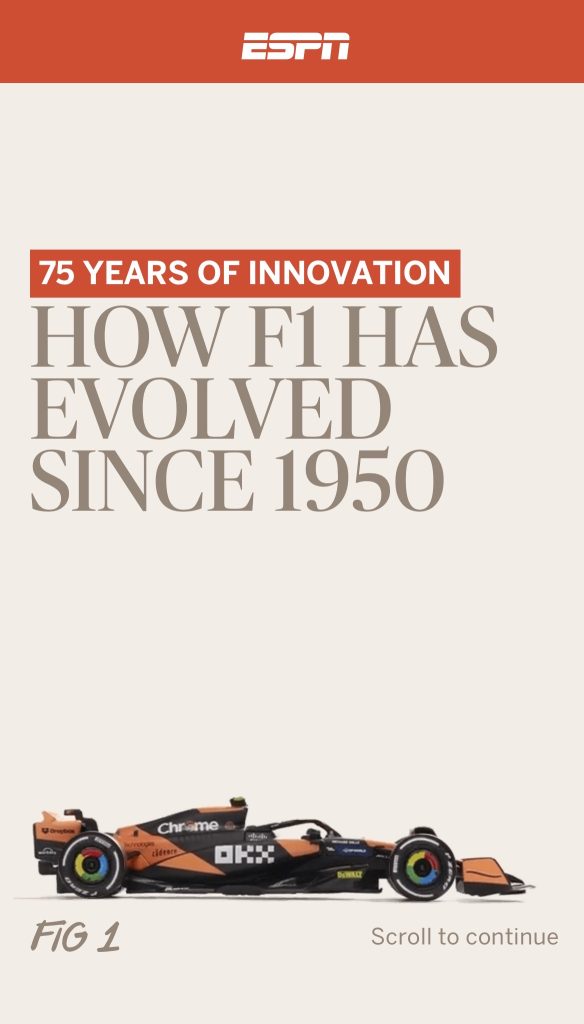
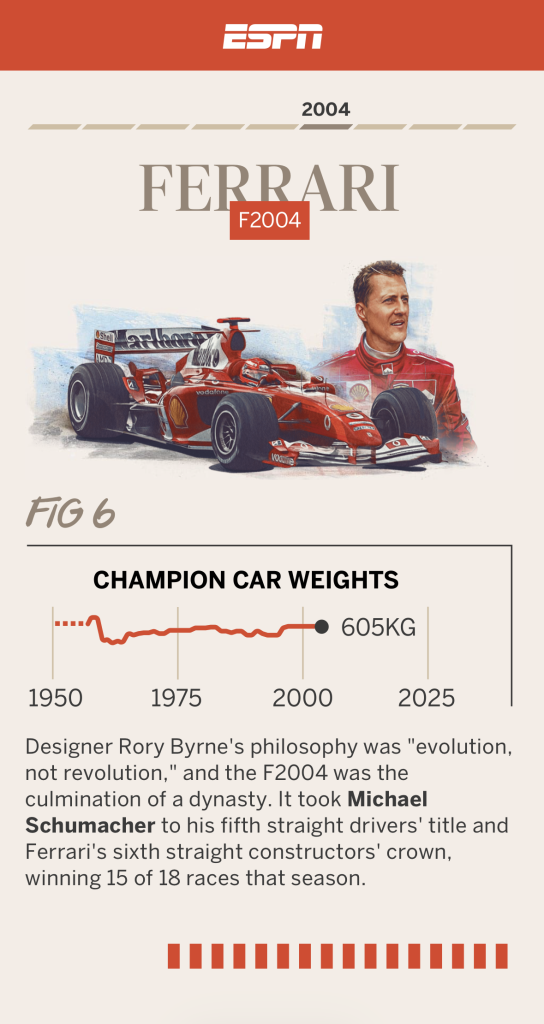
For this project, we created a morphing animation to provide fans with something they weren’t expecting.
![]()